

For more than two decades, game indexing has given the lottery industry a shared language for performance. An index of 100 signals average sales within a comparison group. A score less than 100 suggests below-average performance. And a score topping 100 identifies an above-average game. Simple, consistent and widely understood, indexing has helped lotteries distinguish stronger products from weaker ones and make better portfolio decisions.
The instant scratch game business has evolved dramatically since MAP (Marketing Analysis Planning) was developed by Scientific Games in 2004. The approach, pioneering at the time, has served the lottery industry well. As the industry has evolved, indexing should as well.
The U.S. market once saw about 2,000 game launches annually, with more than 70% priced below $5. Today, the number of launches each year remains around 2,100, but games under $5 account for only 36% of the market, while 16% are priced at $20 or more. More lotteries, more price points, and more specialized products have made the marketplace far more complex.
Haley Bobo, Lead, Strategic Account Enablement for Scientific Games, explains: “The way indexing has been done for the past 20 years is not wrong, but it’s no longer modern. The market is different, and now indexing has to evolve.”
When the Benchmark Blurs the Story
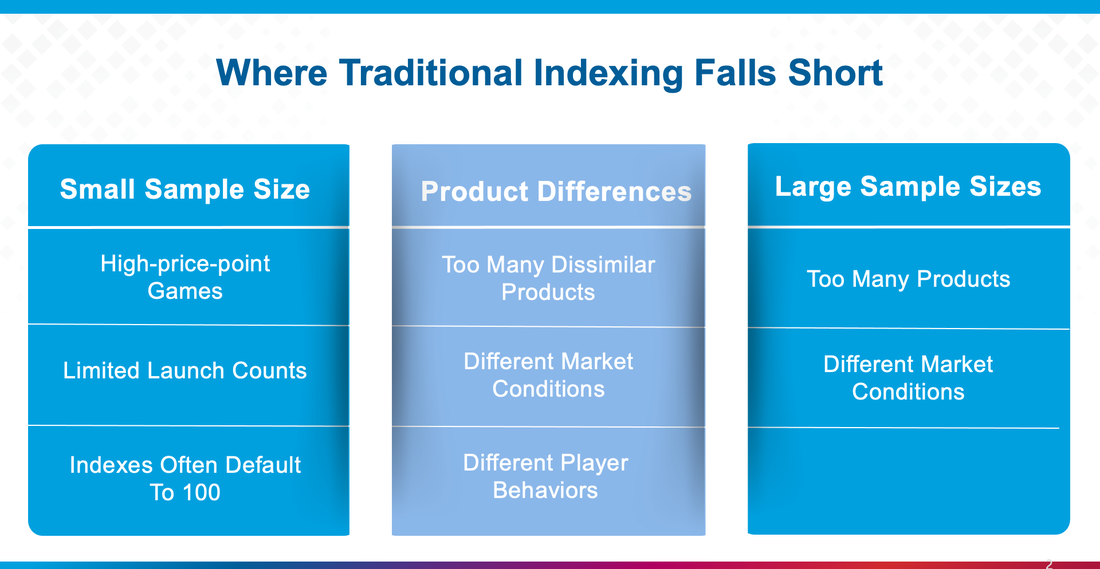
Traditional fiscal indexing compares a game’s first 16 weeks of sales with games at the same price point launched in the same jurisdiction and fiscal year. Static indexing expands that comparison to all historical launches at the same price point. Both methods bring consistency, but each can obscure the story the data is meant to tell.
Small comparison groups are one challenge, particularly for higher-price-point games with limited annual launches.
If only two games launch at a price point, one may receive an extremely high index and the other an extremely low one, even if both perform well. If only one game launches, its fiscal index defaults to 100, a mathematically tidy score that reveals almost nothing.
Broad comparison groups create a different problem. An extended-play game and a multiplier game may serve distinct player interests and different roles in a portfolio. Measuring them as though they were interchangeable can undervalue a product that is doing exactly what it was designed to do. Very large cohorts (groups of games that share similar characteristics) can also compress differences and make meaningful performance patterns harder to see.
Anyone who has encountered a gallery of games all carrying the same 100 index understands the frustration. As Bobo puts it, “A score that tells you almost nothing doesn’t help anyone make a better decision.”
A New Generation of Indexing
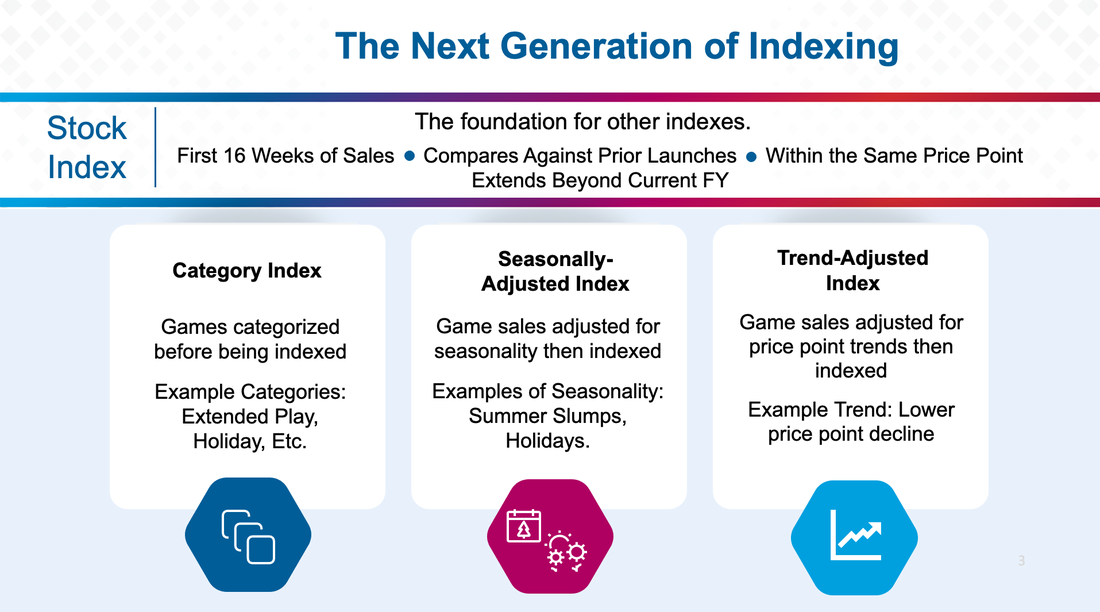
Scientific Games’ new framework begins with the Stock Index, which serves as the foundation for several additional, more revealing measures.
- The Stock Index, examines the first 16 weeks of sales for games at the same price point, like traditional indexes.
- The difference is the cohort, a game is compared with the 12 previously launched games, or up to three years of prior launches, whichever comes first.
That change matters. Once a game’s 16-week sales period ends, its Stock Index does not shift because of games launched later. It also avoids comparing a product with market conditions that did not exist when the game entered the portfolio.
These measures are not competing answers. Together, they explain why a game earned its score.
In one example, a game rated 95 under the traditional fiscal method, suggesting below-average performance. Its Stock Index rose to 103 after the cohort was limited to prior launches. Once seasonality was removed, the score climbed to 107, revealing that a competing game’s apparent strength was driven largely by launching during the lottery’s busiest sales period.

From Scorekeeping to Strategy
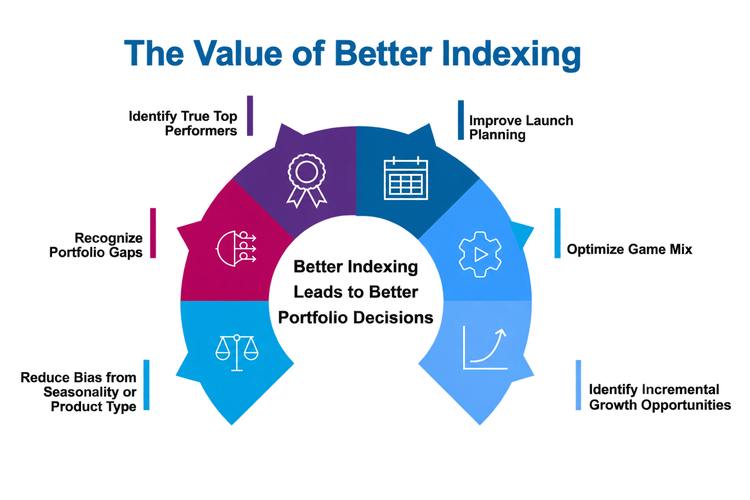
This more nuanced approach transforms indexing from a retrospective scorecard into a forward-looking planning tool. With a clearer view of true top performers, lotteries can improve launch planning, optimize the game mix, recognize portfolio gaps and identify incremental growth opportunities. Just as important, they can reduce bias caused by seasonality, product type or market trends.
The goal is not to discard the common performance language that has served the industry well. It is to make that language more precise for today’s market, and more useful for the decisions lotteries must make next.
“We are asking the industry to embrace a new way of measuring success,” Bobo says. “If a lottery wants to optimize its game mix, we cannot continue to look at sales performance the same way we have for decades.”
Better measurement creates better understanding. Better understanding leads to better games. And better games build stronger, more intentional portfolios, moving beyond a single number and closer to the full story of performance.
© 2026 Scientific Games, LLC. All Rights Reserved.